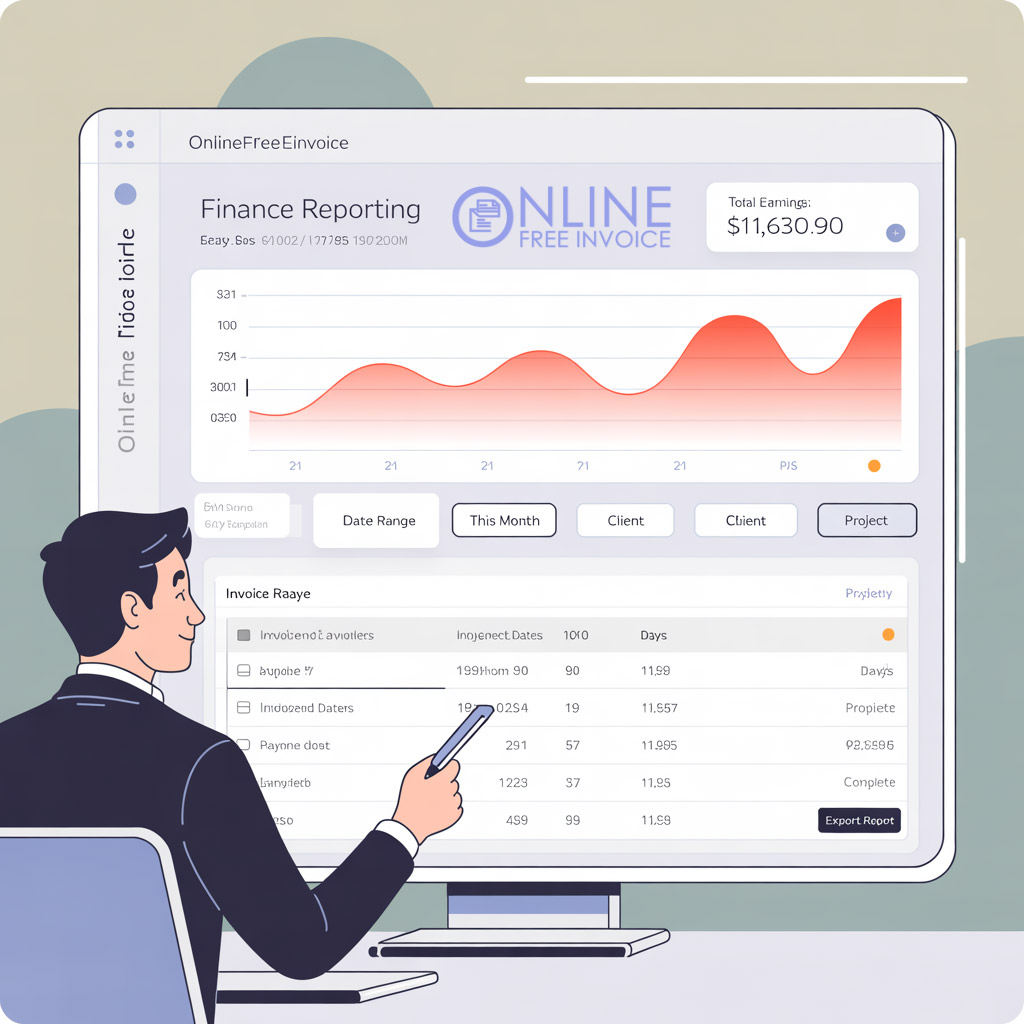
OnlineFreeInvoice makes it simple to understand your business finances. The Finance Report page gives you a complete overview of your earnings, based on paid invoices. Whether you’re a freelancer, a small business owner, or managing multiple clients and projects, our financial dashboard helps you stay informed and make better decisions.
Real-Time Earnings Insight - Finance Reporting
As soon as your client makes a payment, the system updates your Finance Report instantly. All paid invoices are automatically reflected, giving you a live view of your total earnings.
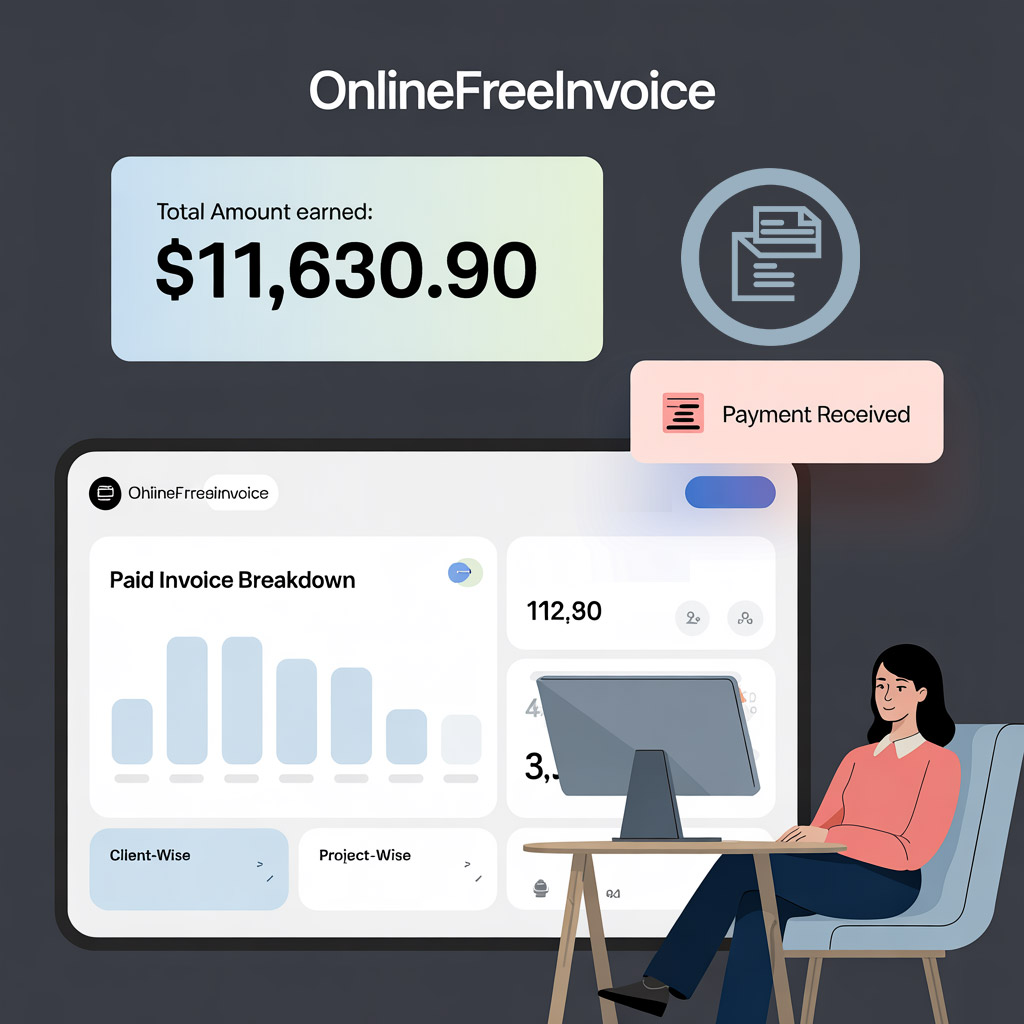
Total amount earned
Paid invoice breakdown
Client-wise and project-wise income tracking
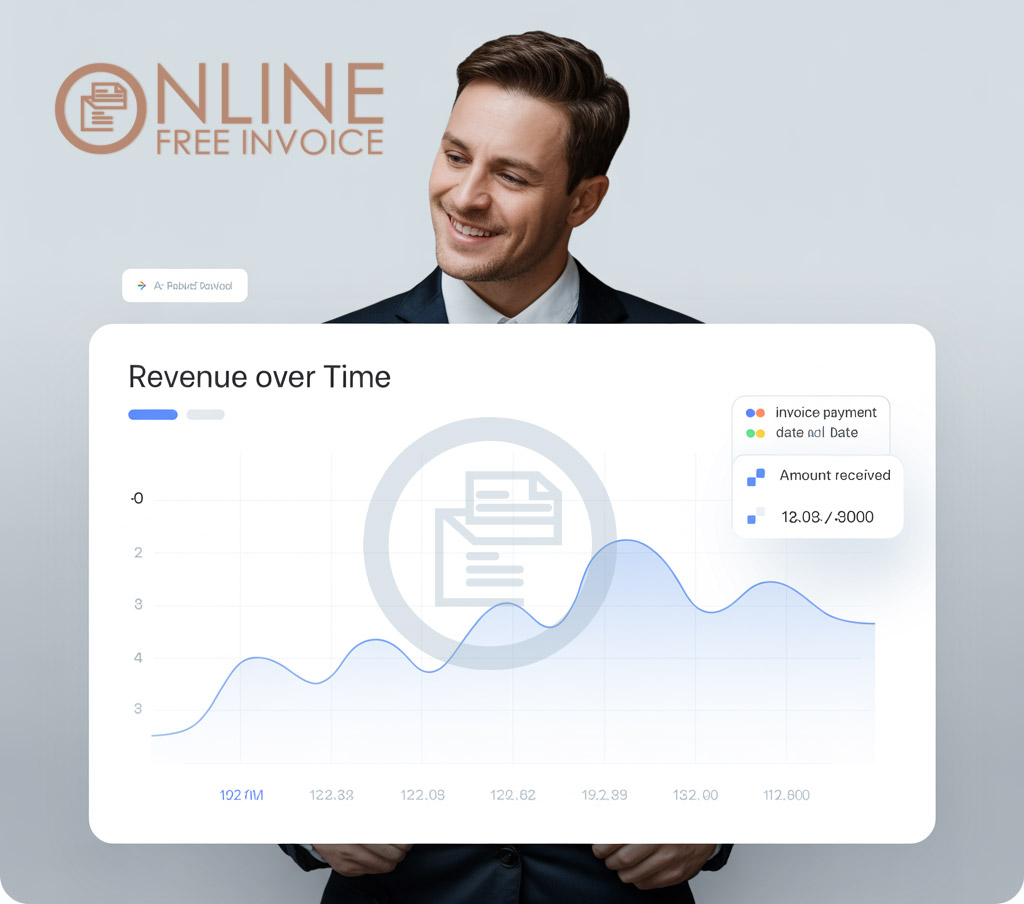
Visual Finance Graph
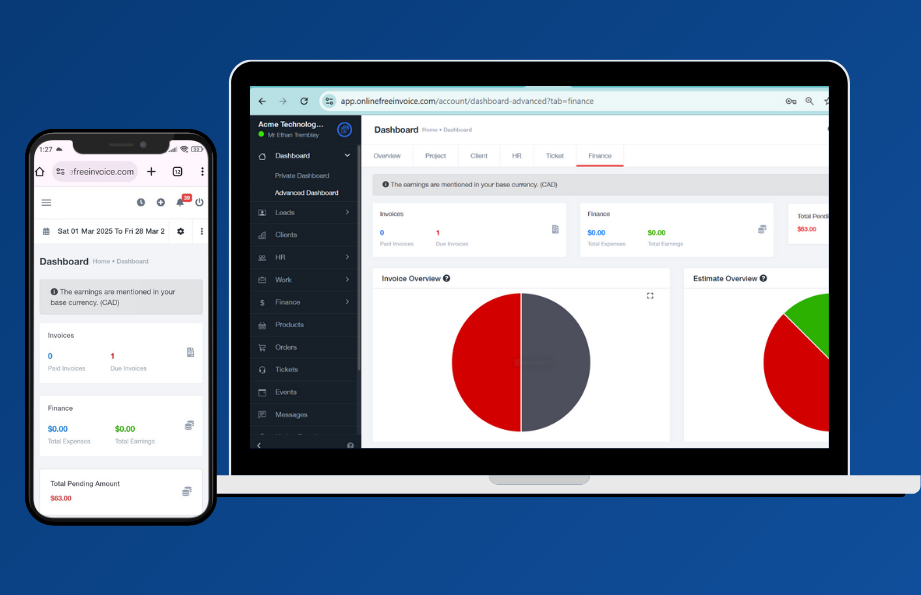
Easily understand your revenue flow with our smart, interactive graph. The chart displays payments received over time, making it easier to identify income trends, high-performing periods, and opportunities for growth.
Each point on the graph represents:
The invoice payment date
The amount received
A smooth visual trend line showing fluctuations in income
The shaded area helps you visually compare earnings between days, weeks, or months.
Advanced Filtering Options
Date – Today, Yesterday, This Month, Last Month, 90 Days, 6 Months, 1 Year, or custom date range.
Task Status – Choose what type of tasks you want to see (e.g., only “Doing” or “Completed”).
Project Filter – Review income per project. This helps in tracking which projects are most profitable or consistent.
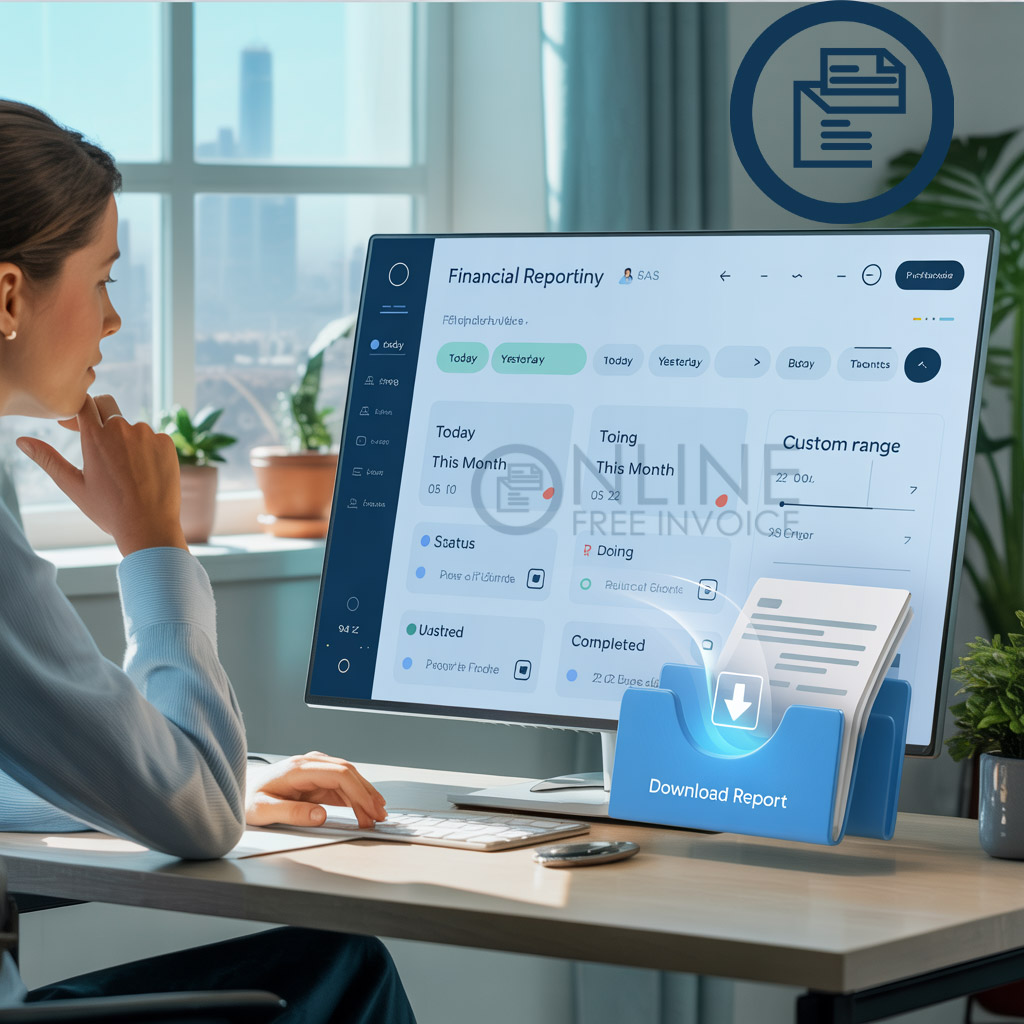
Export Financial Reports – Need to send your earnings report to your accountant or keep a local copy? Simply click Export, and download your finance report with one click. Share it with your team or store it for future reference.
See your company’s income trends visualized over days, weeks, or months with our sleek, easy-to-understand graph. Each point on the graph represents payments received, helping you track performance at a glance.